
As distributed systems are too complex for fully deterministic testing, AI can help. This article proposes an approach inspired by chaos engineering and AI-assisted testing. The emphasis moves from testing individual components to understanding what happens when many services operate together under unpredictable conditions.
Knowing the Issue
Imagine completing an inventory check only to end up with “never updated” stock levels. An order confirmation lands in the wrong inbox. You run your unit tests—everything passes. Nothing is obviously broken. That’s the kind of failure that makes these issues so difficult: the bug isn’t sitting in one place; it lives in the connections.
Modern systems are a web of databases, caches, messaging queues, microservices, API gateways, and more, all interacting in a constantly changing flow. A single user request might touch six or seven components before it completes. Tests typically validate each part in isolation, which works until you remember production never runs in isolation. Issues slip through not because one service failed outright, but because nobody tested what happens when two “seventy-percent-correct” behaviors collide at the same time.
Cache inconsistencies, retry amplification, asynchronous message reordering—the usual suspects. Gartner research suggests a significant share of distributed system failures can be traced back to problems like these.
Launching CLSSM
The model described above, Cross-Layer Synthetic Scenario Modeling (CLSSM), can be used to address this. It may be more accurate to view CLSSM as a structured practice—rooted in chaos engineering and AI-assisted testing—rather than as an established industry term.
The focus shifts from testing individual pieces to understanding what happens when many services run together under unpredictable conditions.
Figure 1 shows how the Engineering and Operational Modes of an AI system interact and feed into each other.
Figure 1: interaction between the Engineering and Operational Modes of an AI system
Modeling System Interactions
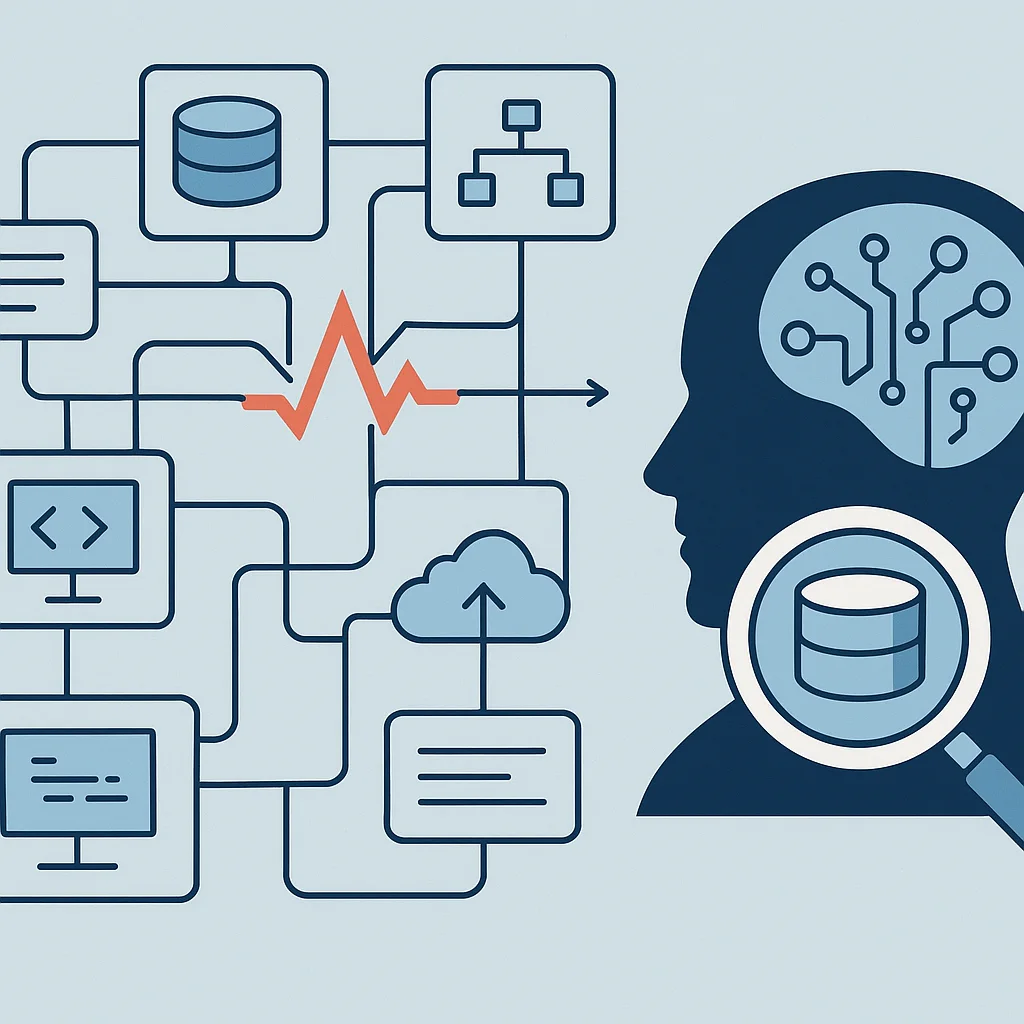
Before you can reliably test how your system fails, you need a candid understanding of how it actually behaves—not the architecture diagram from last month, but what’s occurring in production today. Add OpenTelemetry instrumentation to your services and capture distributed traces. Feed them into Jaeger or Grafana Tempo. The results are often unexpected. Teams frequently uncover call paths nobody documented—synchronous calls hidden inside async flows, retry chains that fan out across multiple services, or cache dependencies missing from everyone’s mental model.
Figure 2 shows how user input flows into an LLM, through supporting tools such as file systems or APIs, and back out as a response.
Figure 2: interaction between user input and the LLM
Generating and Running Scenarios
Once you have the graph, you can decide where to cut. Run your trace data through an AI model—simple clustering or anomaly detection is enough to begin—and have it rank paths by error rate, tail latency, or the number of downstream services involved. The higher the score, the more likely you’ve found the right starting point. Then design scenarios: add an 800ms slowdown to a dependency and observe the effect, trigger rapid retries against a service and see whether the cache behind it degrades, reorder a batch of async messages and verify whether the downstream consumer still behaves correctly. You’re looking for issues that may have been quietly present for months without being detected.
For execution, use tools that can delay or degrade specific dependencies rather than only taking down entire services. Slow responses, dropped connections, artificial timeouts—these better reflect real production degradation. Netflix has written extensively about failure testing, and the underlying idea remains valid: break things before they break in front of users.
Figure 3 shows an AI-based analytics platform with specialised agents handling detection, analysis, and decision support across cloud infrastructure.
Figure 3: AI agents for data analysis: Types, working, mechanism, use cases, benefits, implementation
Table 1: Contrasting Testing Methods
Putting CLSSM Into Practice: A Step-by-Step Guide
Here is how a real team can begin without rebuilding their entire testing stack all at once.
Step 1: Instrument your services with OpenTelemetry
Add the OpenTelemetry SDK to each service and enable distributed tracing—every cross-service call should carry a trace ID so you can follow a request end to end. Choose a collector: Jaeger, Zipkin, or Grafana Tempo all work. Two or three days of live traffic is enough to reveal patterns. If instrumenting everything at once feels too heavy, start with your two or three busiest integration points.
Step 2: Build the interaction graph from real trace data
Review your trace data and extract service-to-service call relationships. If you’re using a service mesh, Kiali can produce much of this automatically; otherwise, a short Python script over exported span data is usually sufficient. The end goal is a graph where each node carries three values: average latency, error rate, and call volume. The connections that matter most are those with a problematic mix—high errors, many downstream dependencies, or frequent timeouts. Start there.
Step 3: Use AI to uncover scenarios your team wouldn’t think to write
With the graph built, present it to an LLM or a rule-based analyzer. For example: “Here are our service dependencies and observed error patterns. What are ten failure scenarios that unit and integration tests would miss?” The output is often stronger than expected: specific, plausible situations—payment retries hammering the inventory cache during peak load, a notification queue silently backing up because an email provider is slow, order confirmations arriving out of sequence as a side effect. These aren’t just hypotheticals; they are runnable cases derived from real system behavior.
Step 4: Run it — with the right fault injection setup
If you’re on Kubernetes, Chaos Mesh and LitmusChaos are solid options—define what you want to disrupt (pod failures, network delays, CPU pressure) in YAML and execute the experiment. If you’re not on Kubernetes, Toxiproxy is useful: a small proxy placed in front of HTTP or TCP connections that lets you throttle bandwidth, introduce latency, or cut the connection without changing the underlying infrastructure. Before each run, record your baseline—error rate, latency, throughput. Without that, you can’t reliably define what “recovered” means.
Step 5: Watch the numbers that actually matter
As each scenario runs, track five signals: error rate at each involved service boundary, p99 latency on the impacted path, retry counts, queue depth, and time to recover after the fault is removed. That last measure—how quickly the system returns to normal—is often the most revealing. Monitor these across repeated runs to surface patterns. Some areas improve quietly. Others degrade slowly. Both are important.
Practical Concerns
One of CLSSM’s strengths is its feedback loop: when a scenario exposes unexpected behavior, that path becomes a higher priority in the next cycle. Over time, testing effort naturally concentrates on the most failure-prone areas.
At the same time, the approach depends on strong observability practices and can introduce additional overhead. For teams early in adoption, the most practical approach is usually to focus on a small set of critical processes.
Figure 4 shows the four-stage feedback loop—Design, Collect, Analyze, Respond—that supports continuous improvement in the CLSSM approach.
Figure 4: feedback-loops-in-training-program-evaluations
In conclusion
Distributed systems are too complex to rely on deterministic testing alone. The key question is whether your current validation approach can catch interaction-driven failures before they reach production.
It’s not whether these failures will occur, but when (and whether we detect them during testing or only after the system is in use).
References
1. Citations Gartner. “Distributed Systems Reliability and the Cost of Cross-Service Failures.” https://www.gartner.com (2023)
2. “Chaos Engineering.” Netflix Tech Blog, 2016. https://netflixtechblog.com/chaos-engineering-upgraded-878d341f15fa
3. OpenTelemetry Documentation. https://opentelemetry.io/docs/
4. Principles of Chaos Engineering. (2019). Available at: https://principlesofchaos.org